colour.plotting.plot_multi_cctfs#
- colour.plotting.plot_multi_cctfs(cctfs: Callable | str | Sequence[Callable | str], cctf_decoding: bool = False, **kwargs: Any) Tuple[Figure, Axes][source]#
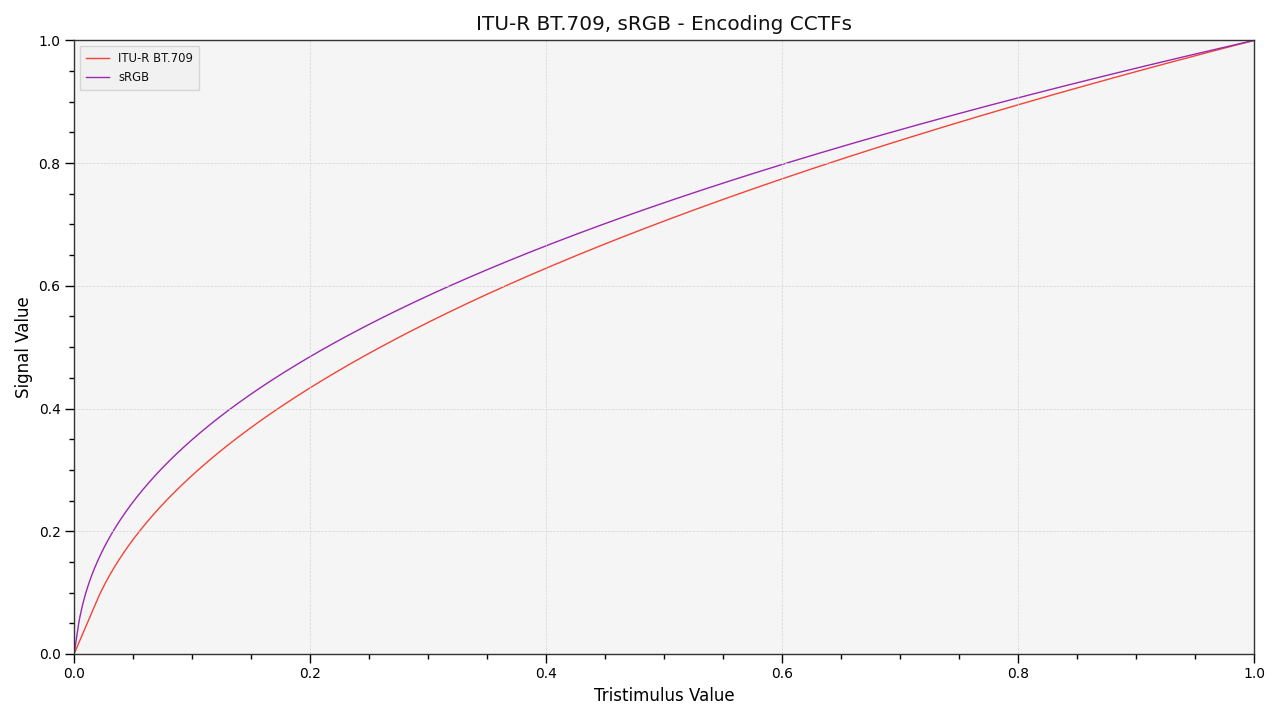
Plot the specified colour component transfer functions.
- Parameters:
cctfs (Callable | str | Sequence[Callable | str]) – Colour component transfer function to plot.
cctfselements can be of any type or form supported by thecolour.plotting.common.filter_passthrough()definition.cctf_decoding (bool) – Plot the decoding colour component transfer function instead.
kwargs (Any) – {
colour.plotting.artist(),colour.plotting.plot_multi_functions(),colour.plotting.render()}, See the documentation of the previously listed definitions.
- Returns:
Current figure and axes.
- Return type:
Examples
>>> plot_multi_cctfs(["ITU-R BT.709", "sRGB"])
(<Figure size ... with 1 Axes>, <...Axes...>)