colour.plotting.plot_RGB_colourspace_section#
- colour.plotting.plot_RGB_colourspace_section(colourspace: RGB_Colourspace | LiteralRGBColourspace | str | Sequence[RGB_Colourspace | LiteralRGBColourspace | str], model: LiteralColourspaceModel | str = 'CIE xyY', axis: Literal['+z', '+x', '+y'] | str = '+z', origin: float = 0.5, normalise: bool = True, size: float = 1.0, show_section_colours: bool = True, show_section_contour: bool = True, segments: int = 64, **kwargs: Any) Tuple[Figure, Axes][source]#
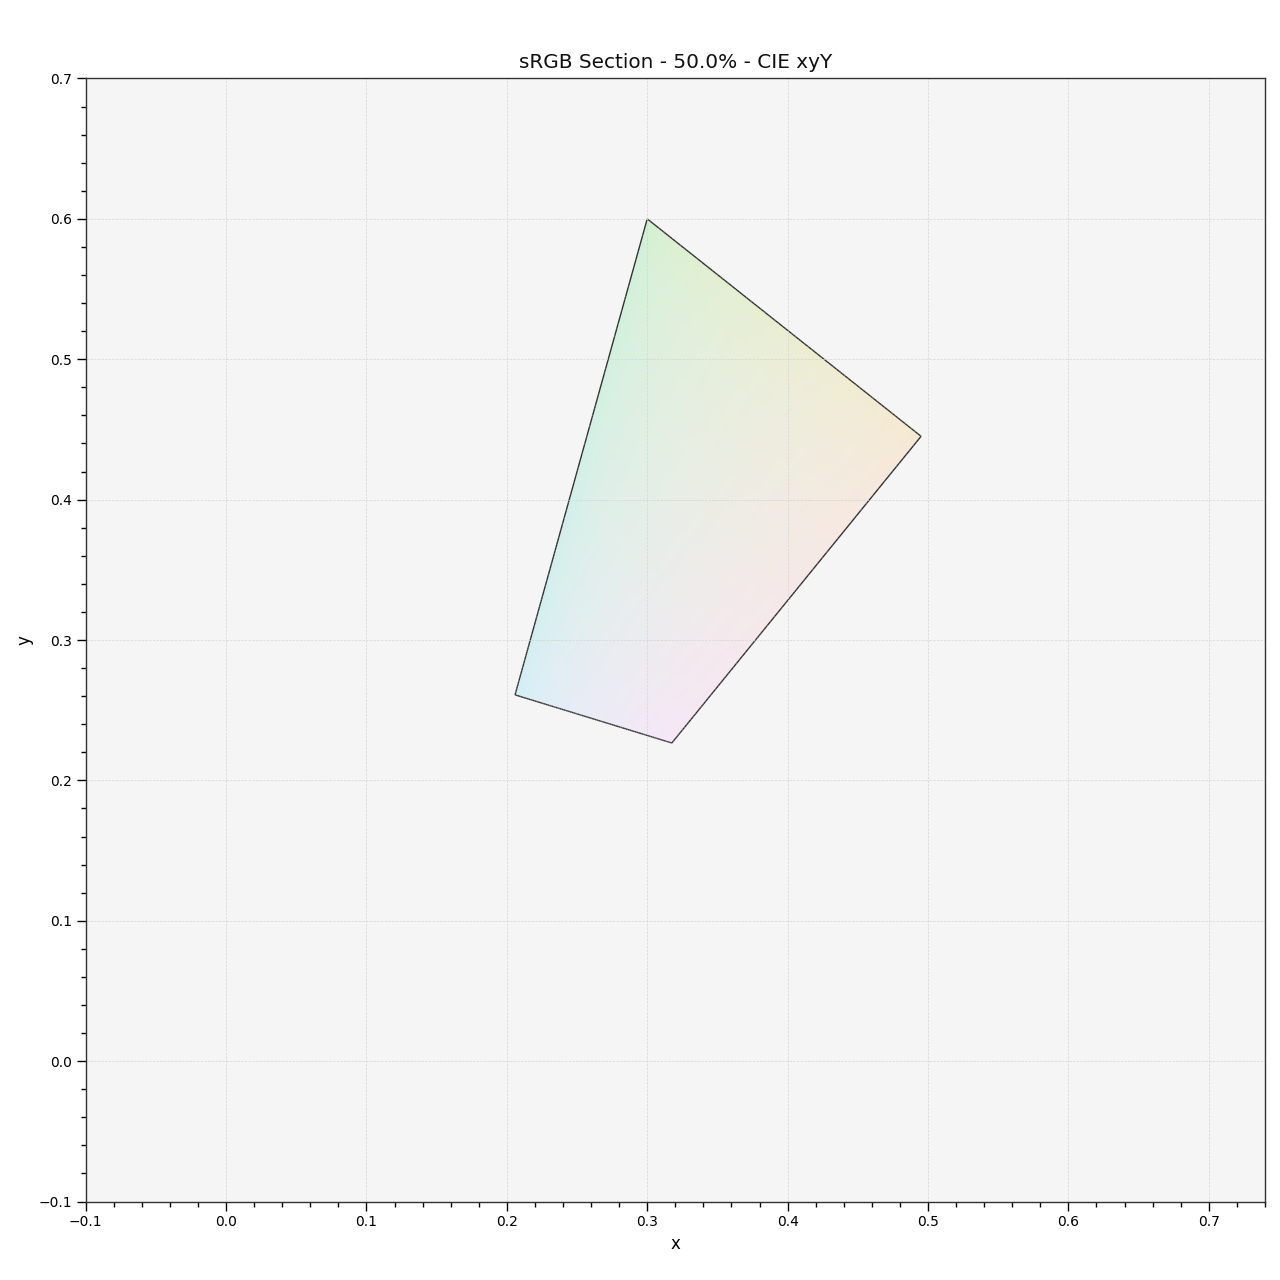
Plot the specified RGB colourspace section colours along the specified axis and origin.
- Parameters:
colourspace (RGB_Colourspace | LiteralRGBColourspace | str | Sequence[RGB_Colourspace | LiteralRGBColourspace | str]) – RGB colourspace of the RGB array.
colourspacecan be of any type or form supported by thecolour.plotting.common.filter_RGB_colourspaces()definition.model (LiteralColourspaceModel | str) – Colourspace model, see
colour.COLOURSPACE_MODELSattribute for the list of supported colourspace models.axis (Literal['+z', '+x', '+y'] | str) – Axis the hull section will be normal to.
origin (float) – Coordinate along
axisat which to plot the hull section.normalise (bool) – Whether to normalise
axisto the extent of the hull along it.size (float) – Size of the underlying RGB colourspace cube; used for plotting HDR related sections.
show_section_colours (bool) – Whether to show the hull section colours.
show_section_contour (bool) – Whether to show the hull section contour.
segments (int) – Edge segments count for the RGB colourspace cube.
kwargs (Any) – {
colour.plotting.artist(),colour.plotting.render(),colour.plotting.section.plot_hull_section_colours()colour.plotting.section.plot_hull_section_contour()}, See the documentation of the previously listed definitions.
- Returns:
Current figure and axes.
- Return type:
Examples
>>> from colour.utilities import is_trimesh_installed
>>> if is_trimesh_installed:
...     plot_RGB_colourspace_section(
...         "sRGB", section_colours="RGB", section_opacity=0.15
...     )
...
(<Figure size ... with 1 Axes>, <...Axes...>)