colour.plotting.plot_single_sd#
- colour.plotting.plot_single_sd(sd: SpectralDistribution, cmfs: MultiSpectralDistributions | str | Sequence[MultiSpectralDistributions | str] = 'CIE 1931 2 Degree Standard Observer', out_of_gamut_clipping: bool = True, modulate_colours_with_sd_amplitude: bool = False, equalize_sd_amplitude: bool = False, **kwargs: Any) Tuple[Figure, Axes][source]#
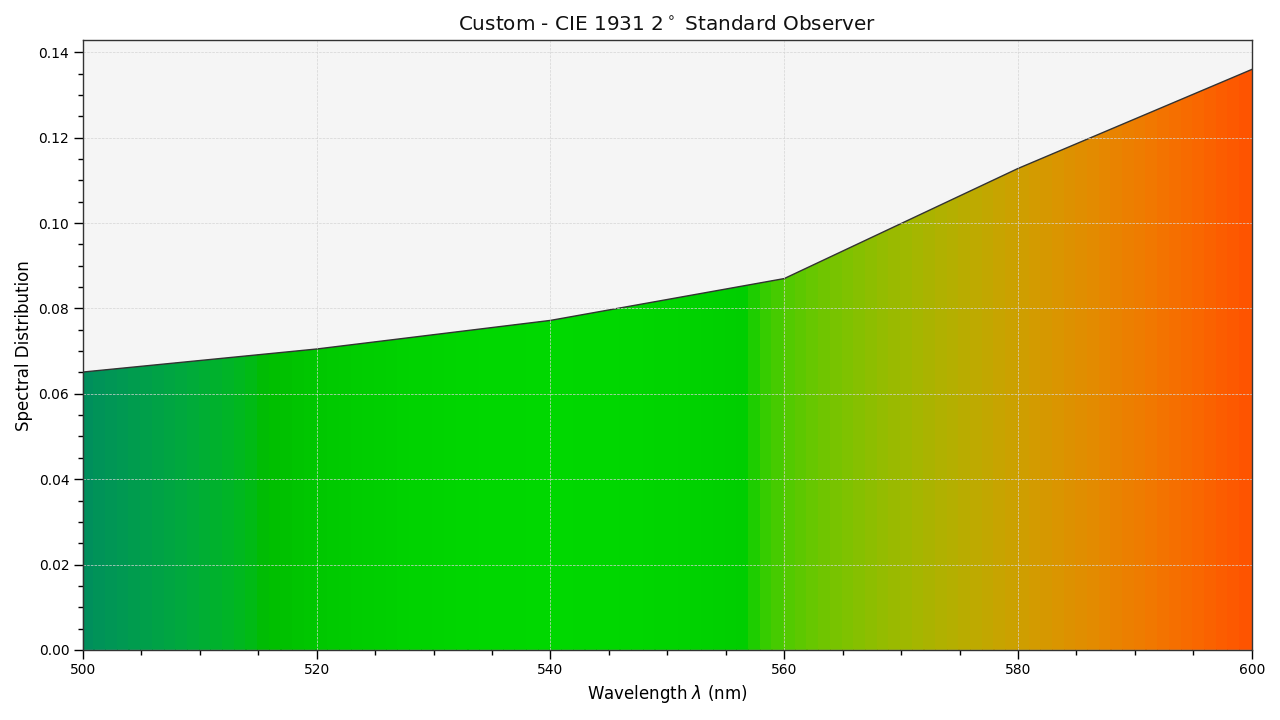
Plot the specified spectral distribution.
- Parameters:
sd (SpectralDistribution) – Spectral distribution to plot.
cmfs (MultiSpectralDistributions | str | Sequence[MultiSpectralDistributions | str]) – Standard observer colour matching functions used for computing the spectrum domain and colours.
cmfscan be of any type or form supported by thecolour.plotting.common.filter_cmfs()definition.out_of_gamut_clipping (bool) – Whether to clip out of gamut colours. Otherwise, the colours will be offset by the absolute minimal colour, resulting in rendering on a gray background that is less saturated and smoother.
modulate_colours_with_sd_amplitude (bool) – Whether to modulate the colours with the spectral distribution amplitude.
equalize_sd_amplitude (bool) – Whether to equalize the spectral distribution amplitude. Equalization occurs after the colours modulation; thus, setting both arguments to True will generate a spectrum strip where each wavelength colour is modulated by the spectral distribution amplitude. The usual 5% margin above the spectral distribution is also omitted.
kwargs (Any) – {
colour.plotting.artist(),colour.plotting.render()}, See the documentation of the previously listed definitions.
- Returns:
Current figure and axes.
- Return type:
References
[Spi15]
Examples
>>> from colour import SpectralDistribution
>>> data = {
...     500: 0.0651,
...     520: 0.0705,
...     540: 0.0772,
...     560: 0.0870,
...     580: 0.1128,
...     600: 0.1360,
... }
>>> sd = SpectralDistribution(data, name="Custom")
>>> plot_single_sd(sd)
(<Figure size ... with 1 Axes>, <...Axes...>)