colour.plotting.plot_the_blue_sky#
- colour.plotting.plot_the_blue_sky(cmfs: MultiSpectralDistributions | str | Sequence[MultiSpectralDistributions | str] = 'CIE 1931 2 Degree Standard Observer', **kwargs: Any) Tuple[Figure, Axes][source]#
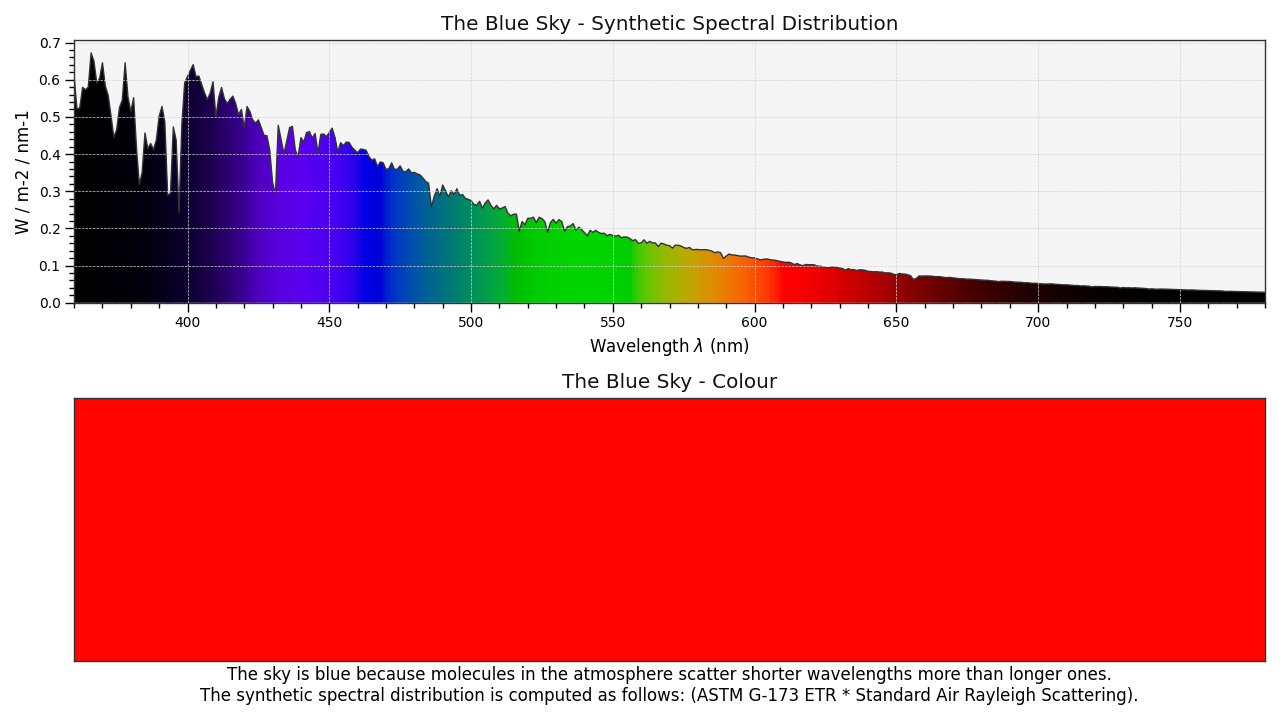
Plot the blue sky spectral radiance distribution.
- Parameters:
cmfs (MultiSpectralDistributions | str | Sequence[MultiSpectralDistributions | str]) – Standard observer colour matching functions used for computing the spectrum domain and colours.
cmfscan be of any type or form supported by thecolour.plotting.common.filter_cmfs()definition.kwargs (Any) – {
colour.plotting.artist(),colour.plotting.plot_single_sd(),colour.plotting.plot_multi_colour_swatches(),colour.plotting.render()}, See the documentation of the previously listed definitions.
- Returns:
Current figure and axes.
- Return type:
Examples
>>> plot_the_blue_sky()
(<Figure size ... with 2 Axes>, <...Axes...>)