colour.plotting.plot_multi_sds_colour_rendering_indexes_bars#
- colour.plotting.plot_multi_sds_colour_rendering_indexes_bars(sds: Sequence[SpectralDistribution | MultiSpectralDistributions] | SpectralDistribution | MultiSpectralDistributions | ValuesView, **kwargs: Any) Tuple[Figure, Axes][source]#
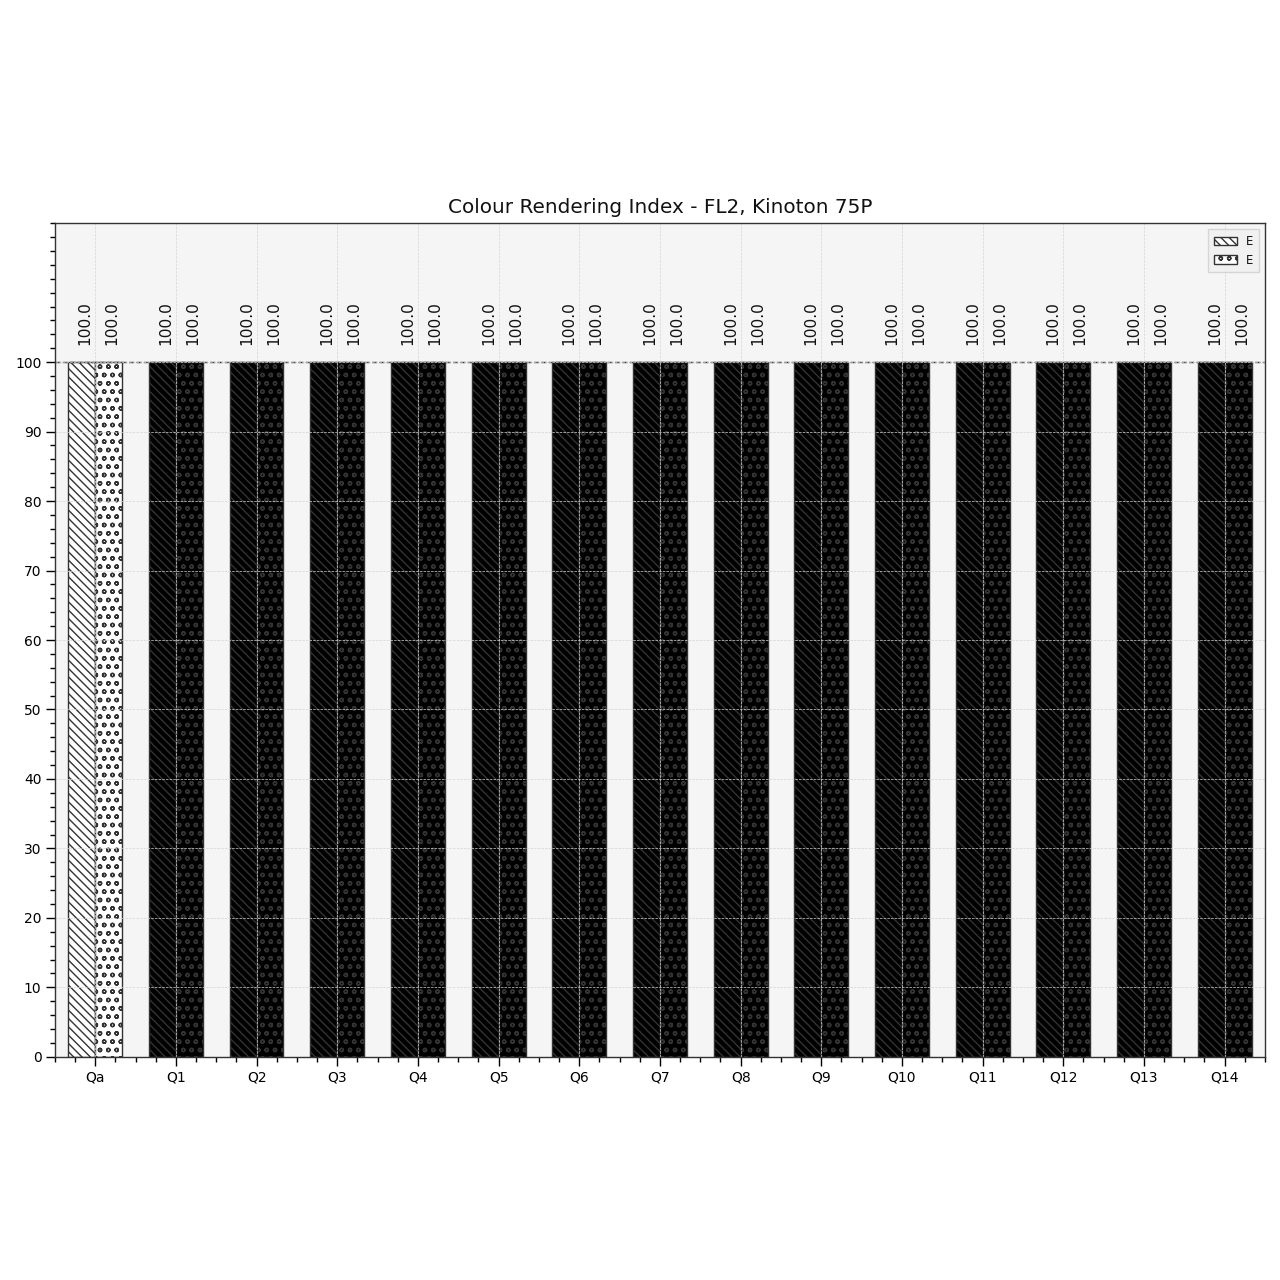
Plot the Colour Rendering Index (CRI) of the specified illuminants or light sources spectral distributions.
- Parameters:
sds (Sequence[SpectralDistribution | MultiSpectralDistributions] | SpectralDistribution | MultiSpectralDistributions | ValuesView) – Spectral distributions or multi-spectral distributions to plot. sds can be a single
colour.MultiSpectralDistributionsclass instance, a list ofcolour.MultiSpectralDistributionsclass instances or a list ofcolour.SpectralDistributionclass instances.kwargs (Any) – {
colour.plotting.artist(),colour.plotting.quality.plot_colour_quality_bars(),colour.plotting.render()}, See the documentation of the previously listed definitions.
- Returns:
Current figure and axes.
- Return type:
Examples
>>> from colour import SDS_ILLUMINANTS, SDS_LIGHT_SOURCES
>>> illuminant = SDS_ILLUMINANTS["FL2"]
>>> light_source = SDS_LIGHT_SOURCES["Kinoton 75P"]
>>> plot_multi_sds_colour_rendering_indexes_bars(
...     [illuminant, light_source]
... )
(<Figure size ... with 1 Axes>, <...Axes...>)