colour.plotting.plot_visible_spectrum_section#
- colour.plotting.plot_visible_spectrum_section(cmfs: MultiSpectralDistributions | str | Sequence[MultiSpectralDistributions | str] = 'CIE 1931 2 Degree Standard Observer', illuminant: SpectralDistribution | str = 'D65', model: LiteralColourspaceModel | str = 'CIE xyY', axis: Literal['+z', '+x', '+y'] | str = '+z', origin: float = 0.5, normalise: bool = True, show_section_colours: bool = True, show_section_contour: bool = True, **kwargs: Any) Tuple[Figure, Axes][source]#
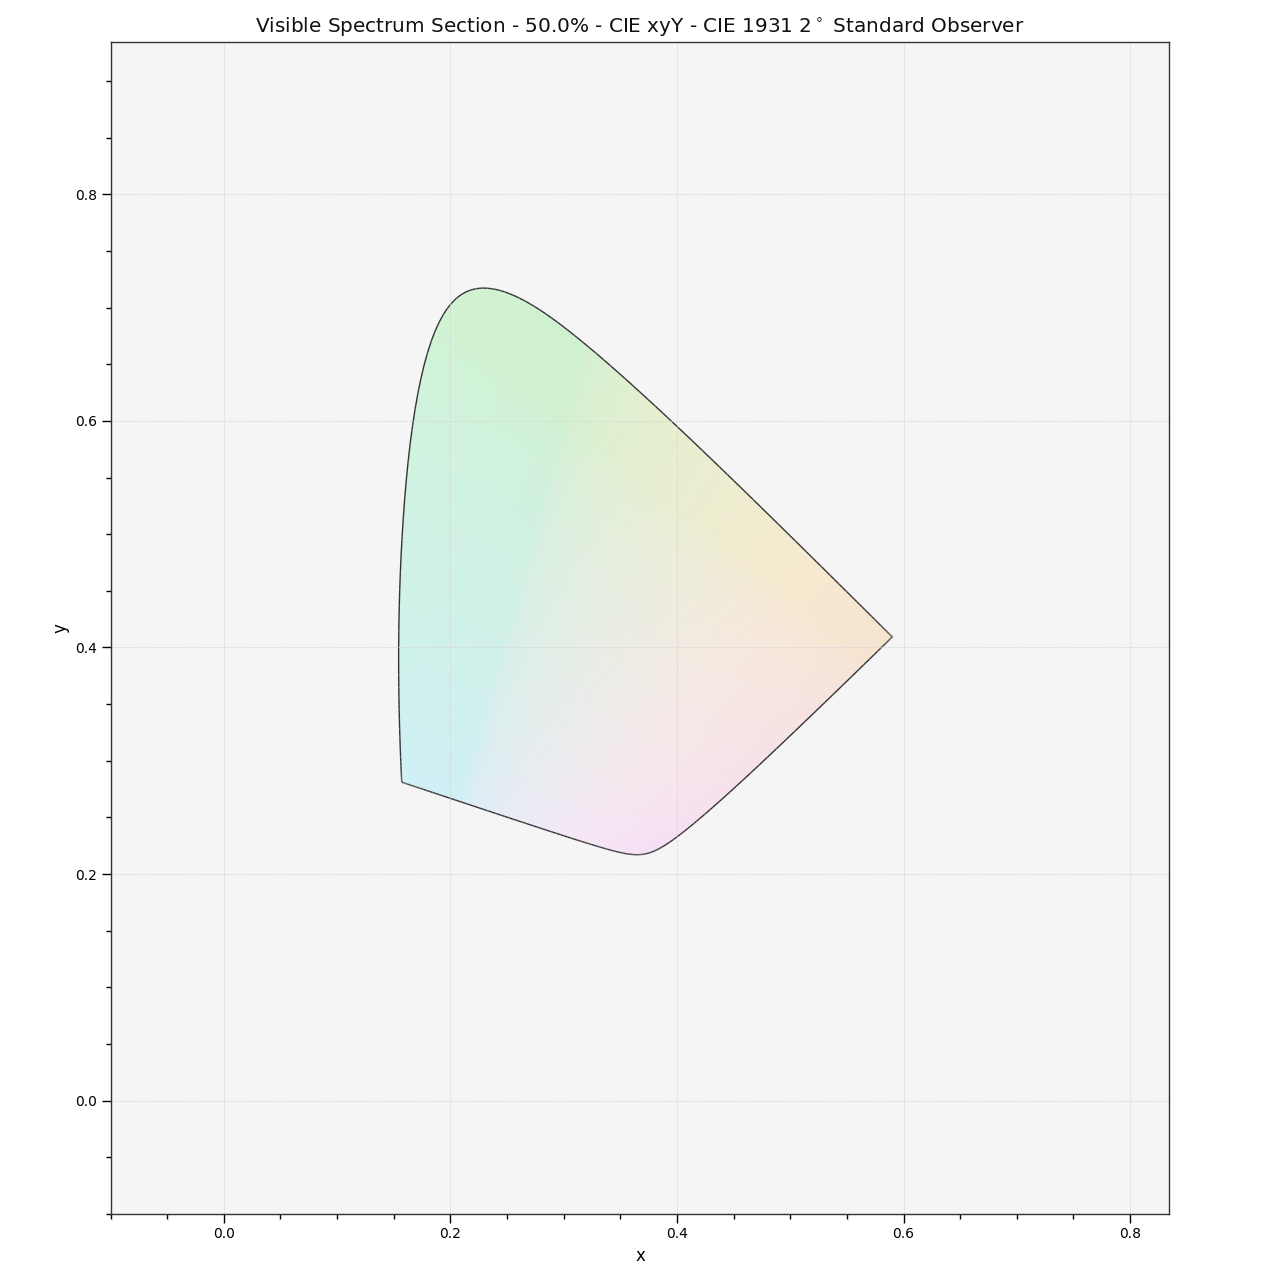
Plot the visible spectrum volume section colours along the specified axis and origin.
The visible spectrum volume represents the Rösch-MacAdam colour solid.
- Parameters:
cmfs (MultiSpectralDistributions | str | Sequence[MultiSpectralDistributions | str]) – Standard observer colour matching functions, default to the CIE 1931 2 Degree Standard Observer.
cmfscan be of any type or form supported by thecolour.plotting.common.filter_cmfs()definition.illuminant (SpectralDistribution | str) – Illuminant spectral distribution, default to CIE Illuminant D65.
illuminantcan be of any type or form supported by thecolour.plotting.common.filter_illuminants()definition.model (LiteralColourspaceModel | str) – Colourspace model, see
colour.COLOURSPACE_MODELSattribute for the list of supported colourspace models.axis (Literal['+z', '+x', '+y'] | str) – Axis the hull section will be normal to.
origin (float) – Coordinate along
axisat which to plot the hull section.normalise (bool) – Whether to normalise
axisto the extent of the hull along it.show_section_colours (bool) – Whether to show the hull section colours.
show_section_contour (bool) – Whether to show the hull section contour.
kwargs (Any) – {
colour.plotting.artist(),colour.plotting.render(),colour.plotting.section.plot_hull_section_colours()colour.plotting.section.plot_hull_section_contour()}, See the documentation of the previously listed definitions.
- Returns:
Current figure and axes.
- Return type:
Examples
>>> from colour.utilities import is_trimesh_installed
>>> if is_trimesh_installed:
...     plot_visible_spectrum_section(section_colours="RGB", section_opacity=0.15)
...
(<Figure size ... with 1 Axes>, <...Axes...>)