colour.plotting.plot_RGB_colourspaces_in_chromaticity_diagram_CIE1976UCS#
- colour.plotting.plot_RGB_colourspaces_in_chromaticity_diagram_CIE1976UCS(colourspaces: RGB_Colourspace | LiteralRGBColourspace | str | Sequence[RGB_Colourspace | LiteralRGBColourspace | str], cmfs: MultiSpectralDistributions | str | Sequence[MultiSpectralDistributions | str] = 'CIE 1931 2 Degree Standard Observer', chromaticity_diagram_callable_CIE1976UCS: Callable = plot_chromaticity_diagram_CIE1976UCS, show_whitepoints: bool = True, show_pointer_gamut: bool = False, chromatically_adapt: bool = False, plot_kwargs: dict | List[dict] | None = None, **kwargs: Any) Tuple[Figure, Axes][source]#
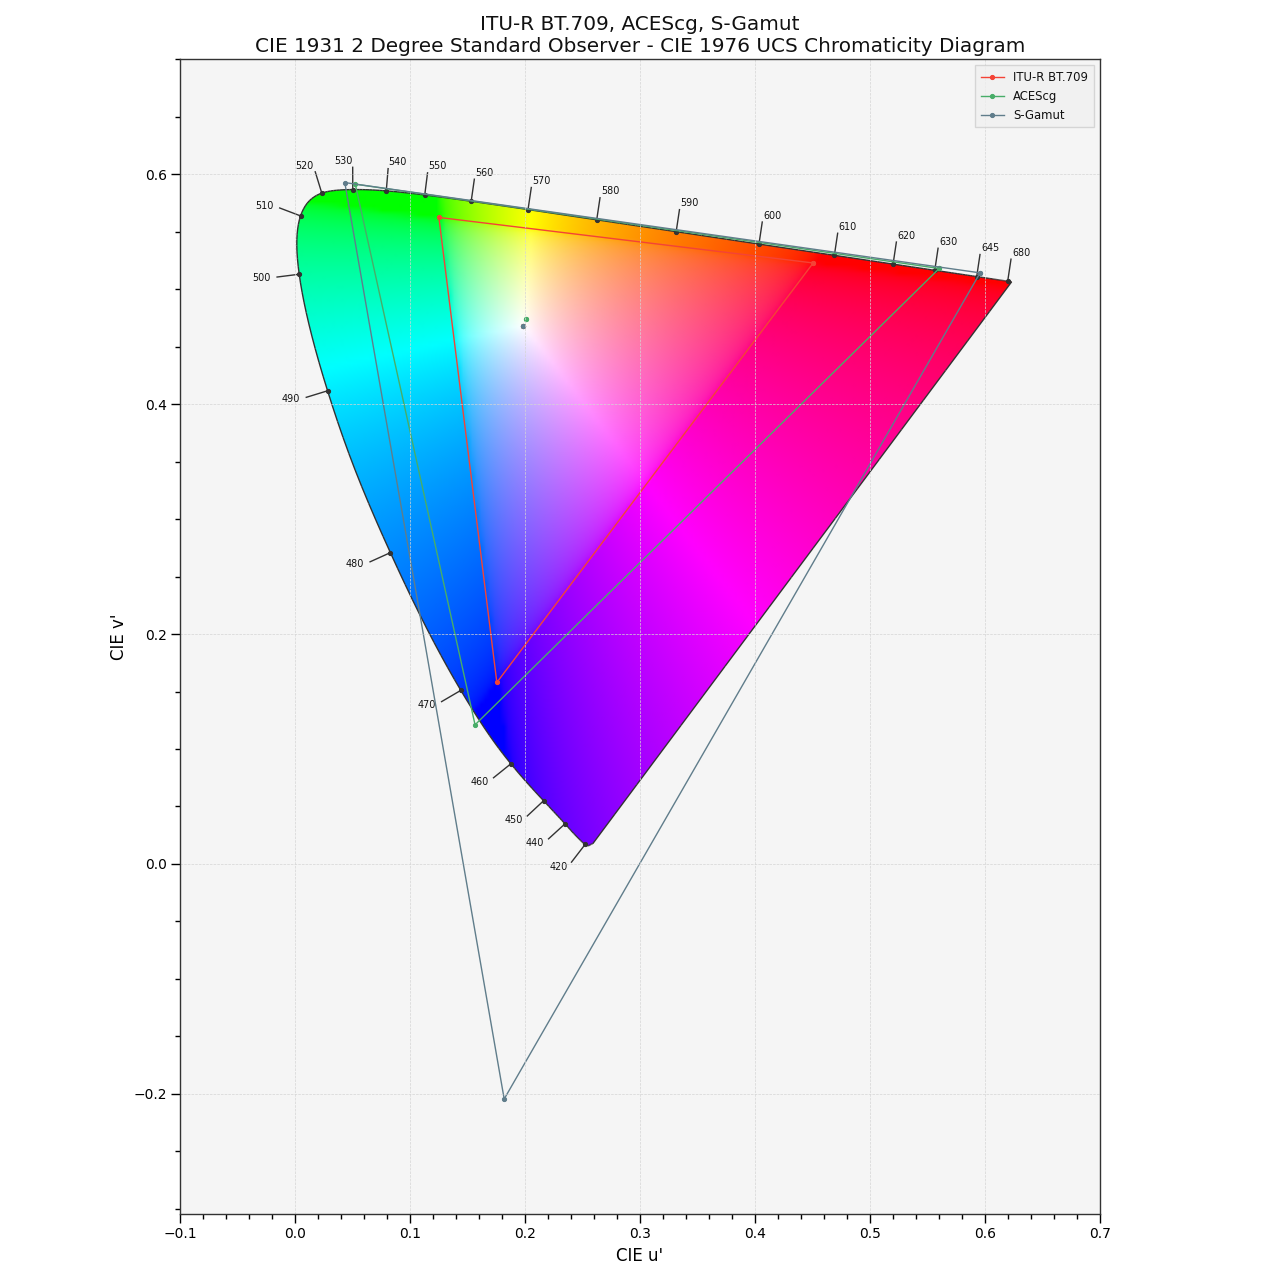
Plot the specified RGB colourspaces in the CIE 1976 UCS Chromaticity Diagram.
- Parameters:
colourspaces (RGB_Colourspace | LiteralRGBColourspace | str | Sequence[RGB_Colourspace | LiteralRGBColourspace | str]) – RGB colourspaces to plot.
colourspaceselements can be of any type or form supported by thecolour.plotting.common.filter_RGB_colourspaces()definition.cmfs (MultiSpectralDistributions | str | Sequence[MultiSpectralDistributions | str]) – Standard observer colour matching functions used for computing the spectral locus boundaries.
cmfscan be of any type or form supported by thecolour.plotting.common.filter_cmfs()definition.chromaticity_diagram_callable_CIE1976UCS (Callable) – Callable responsible for drawing the CIE 1976 UCS Chromaticity Diagram.
show_whitepoints (bool) – Whether to display the RGB colourspaces whitepoints.
show_pointer_gamut (bool) – Whether to display the Pointer’s Gamut.
chromatically_adapt (bool) – Whether to chromatically adapt the RGB colourspaces specified in
colourspacesto the whitepoint of the default plotting colourspace.plot_kwargs (dict | List[dict] | None) – Keyword arguments for the
matplotlib.pyplot.plot()definition, used to control the style of the plotted RGB colourspaces.plot_kwargscan be either a single dictionary applied to all the plotted RGB colourspaces with the same settings or a sequence of dictionaries with different settings for each plotted RGB colourspace.kwargs (Any) – {
colour.plotting.artist(),colour.plotting.diagrams.plot_chromaticity_diagram(),colour.plotting.models.plot_pointer_gamut(),colour.plotting.models.plot_RGB_colourspaces_in_chromaticity_diagram(),colour.plotting.render()}, See the documentation of the previously listed definitions.
- Returns:
Current figure and axes.
- Return type:
Examples
>>> plot_RGB_colourspaces_in_chromaticity_diagram_CIE1976UCS(
...     ["ITU-R BT.709", "ACEScg", "S-Gamut"]
... )
...
(<Figure size ... with 1 Axes>, <...Axes...>)